Analytics and reporting for real estate

Analytics That Turn Data Into Decisions

We turn campaign data into crisp insights, making it easy to see what's working—and where to optimize next. Whether you're running SEO, Google Ads, or a complete lead generation system, transparent dashboards keep your team synchronized.

Marketing analytics on mobile — rankings and visibilityMobile
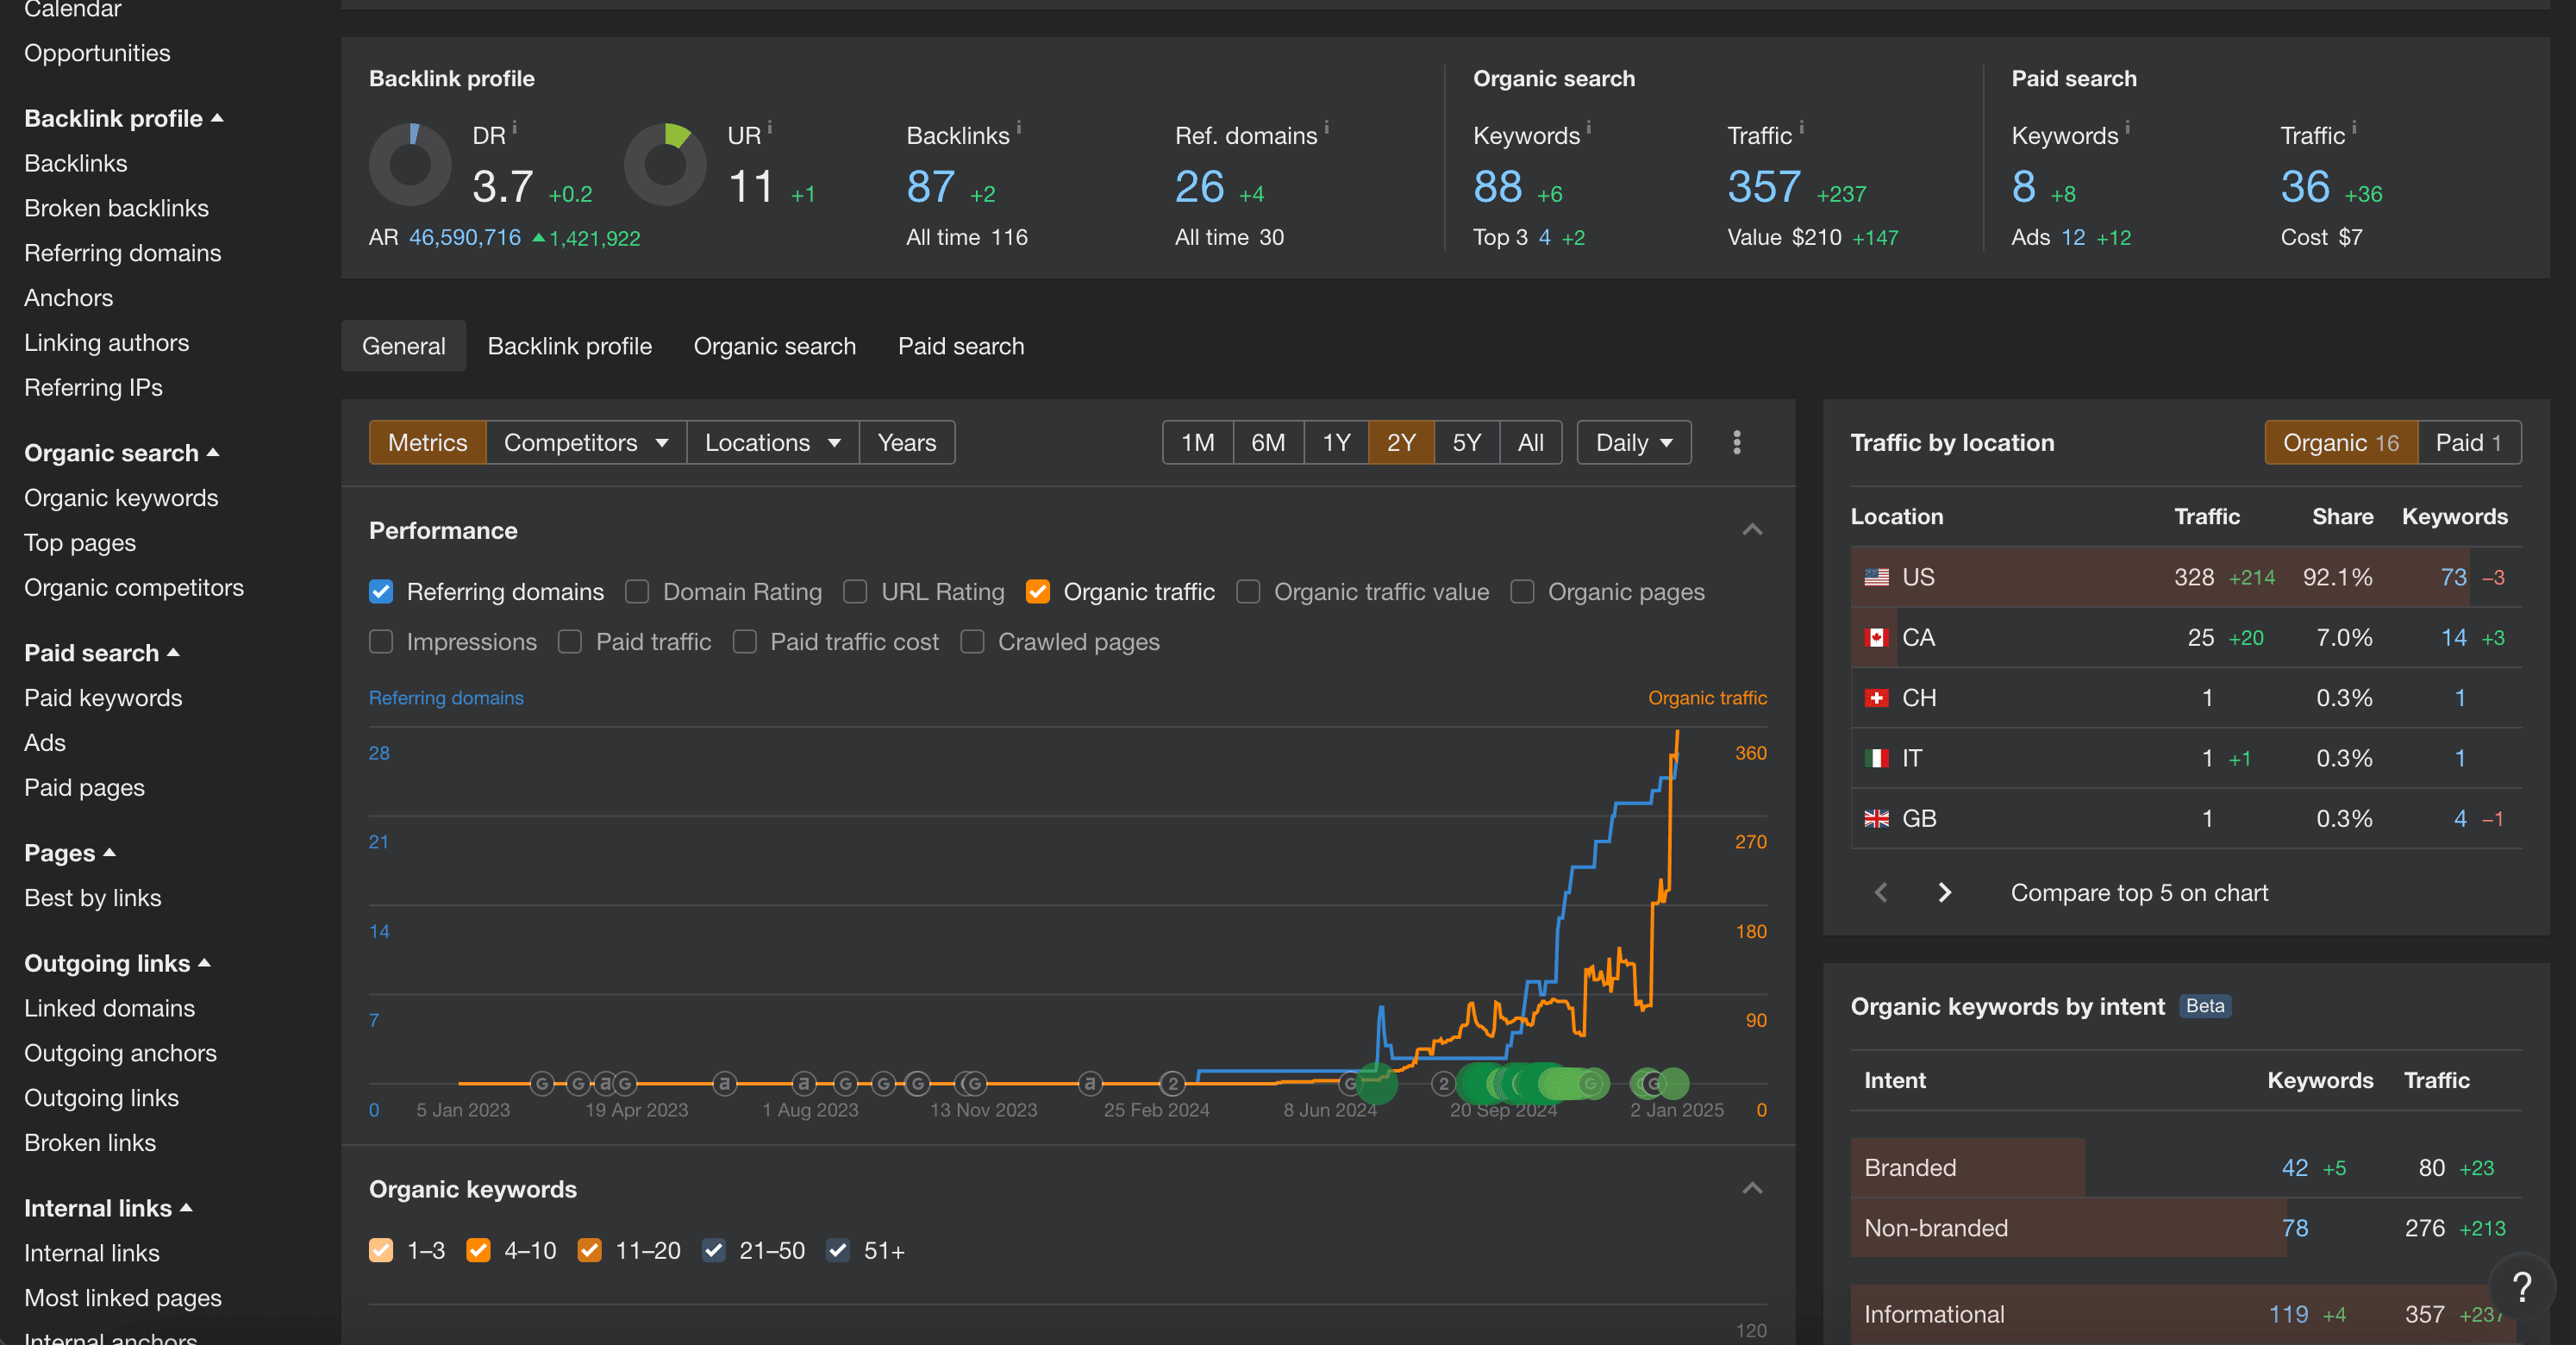
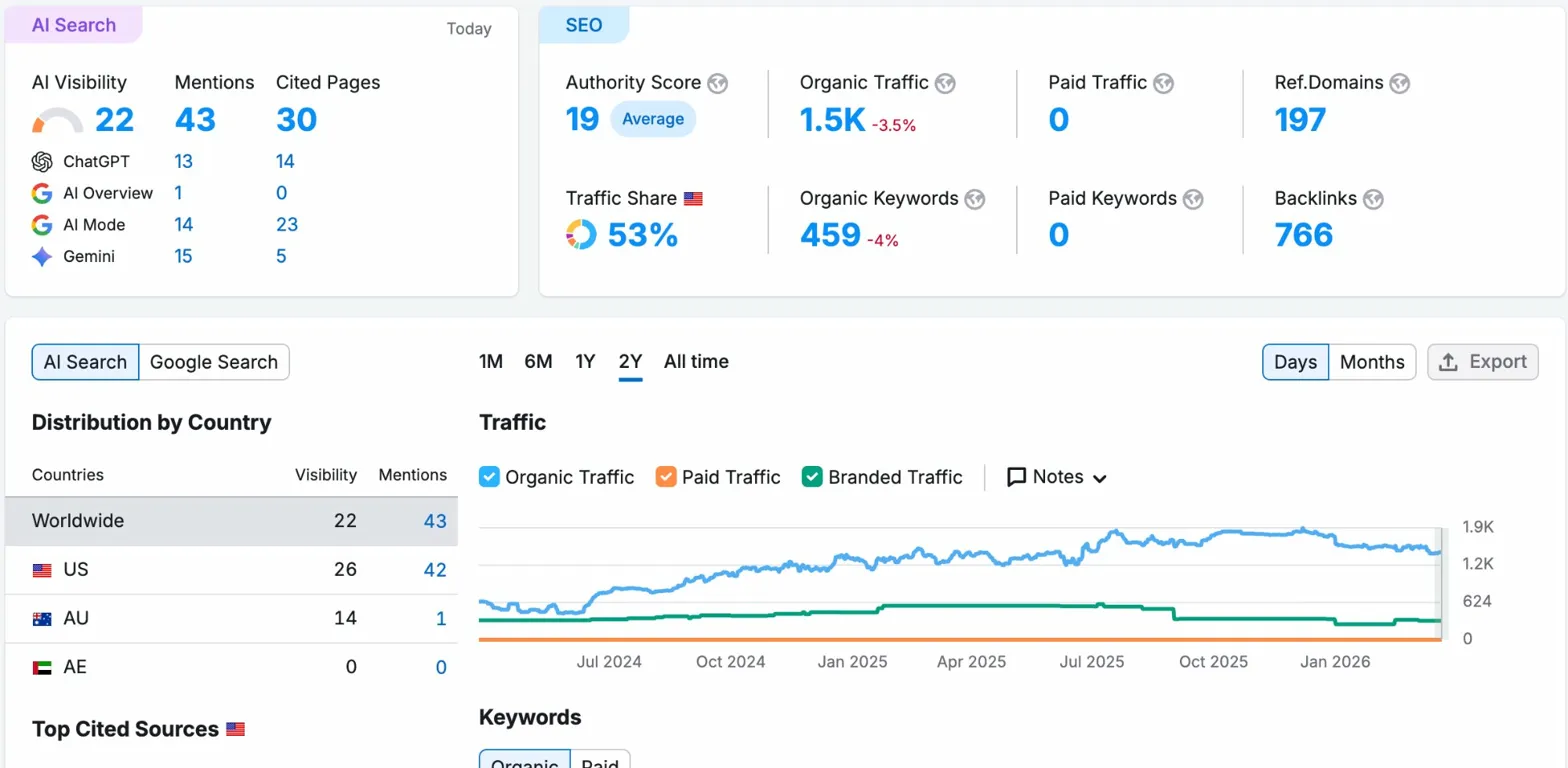
Real estate analytics dashboard on desktop — traffic and growthDesktop
Client logo 1
Client logo 2
Client logo 3
Client logo 4
Client logo 5
Client logo 6
Client logo 7
Client logo 8
Client logo 9
Client logo 10
Client logo 11
Client logo 12
Client logo 13
Client logo 14
Client logo 15
Client logo 16
Client logo 17
Client logo 18
Client logo 19
Client logo 20
Client logo 21
Client logo 22
Client logo 23
Client logo 24

Why analytics matter

Luxury marketing budgets fail when no one agrees what “good” looks like. Measurement is the contract between media, creative, and sales—it tells you where to reallocate this week, not next quarter.

  • You can't optimize what you don't measure—leading indicators precede lagging revenue.
  • Transparency builds trust across marketing, leadership, and field agents.
  • Data-driven decisions beat guesses when markets shift weekly.
  • Real-time dashboards enable agility—pause waste, scale winners while intent is hot.

Black box vs. transparent reporting

Black box reporting versus transparent reporting
Black boxTransparent reporting
Data accessPDFs or opaque summariesLive sources you can inspect
Definitions“Leads” undefinedMQL / tour / GCI aligned in CRM
CadenceQuarterly surprisesWeekly narrative + monthly strategy
OptimizationReactive guessesHypothesis → test → measured outcome

Our Analytics Framework

Four lenses—search, paid, lead, and site—so every optimization has a home and a definition of success.

Search analytics

  • Keyword rankings and visibility trends—not vanity averages hiding losses.
  • Organic traffic, impressions, and query themes that explain who arrived and why.
  • Click-through rates from SERP to landing—diagnosing message match and snippet quality.
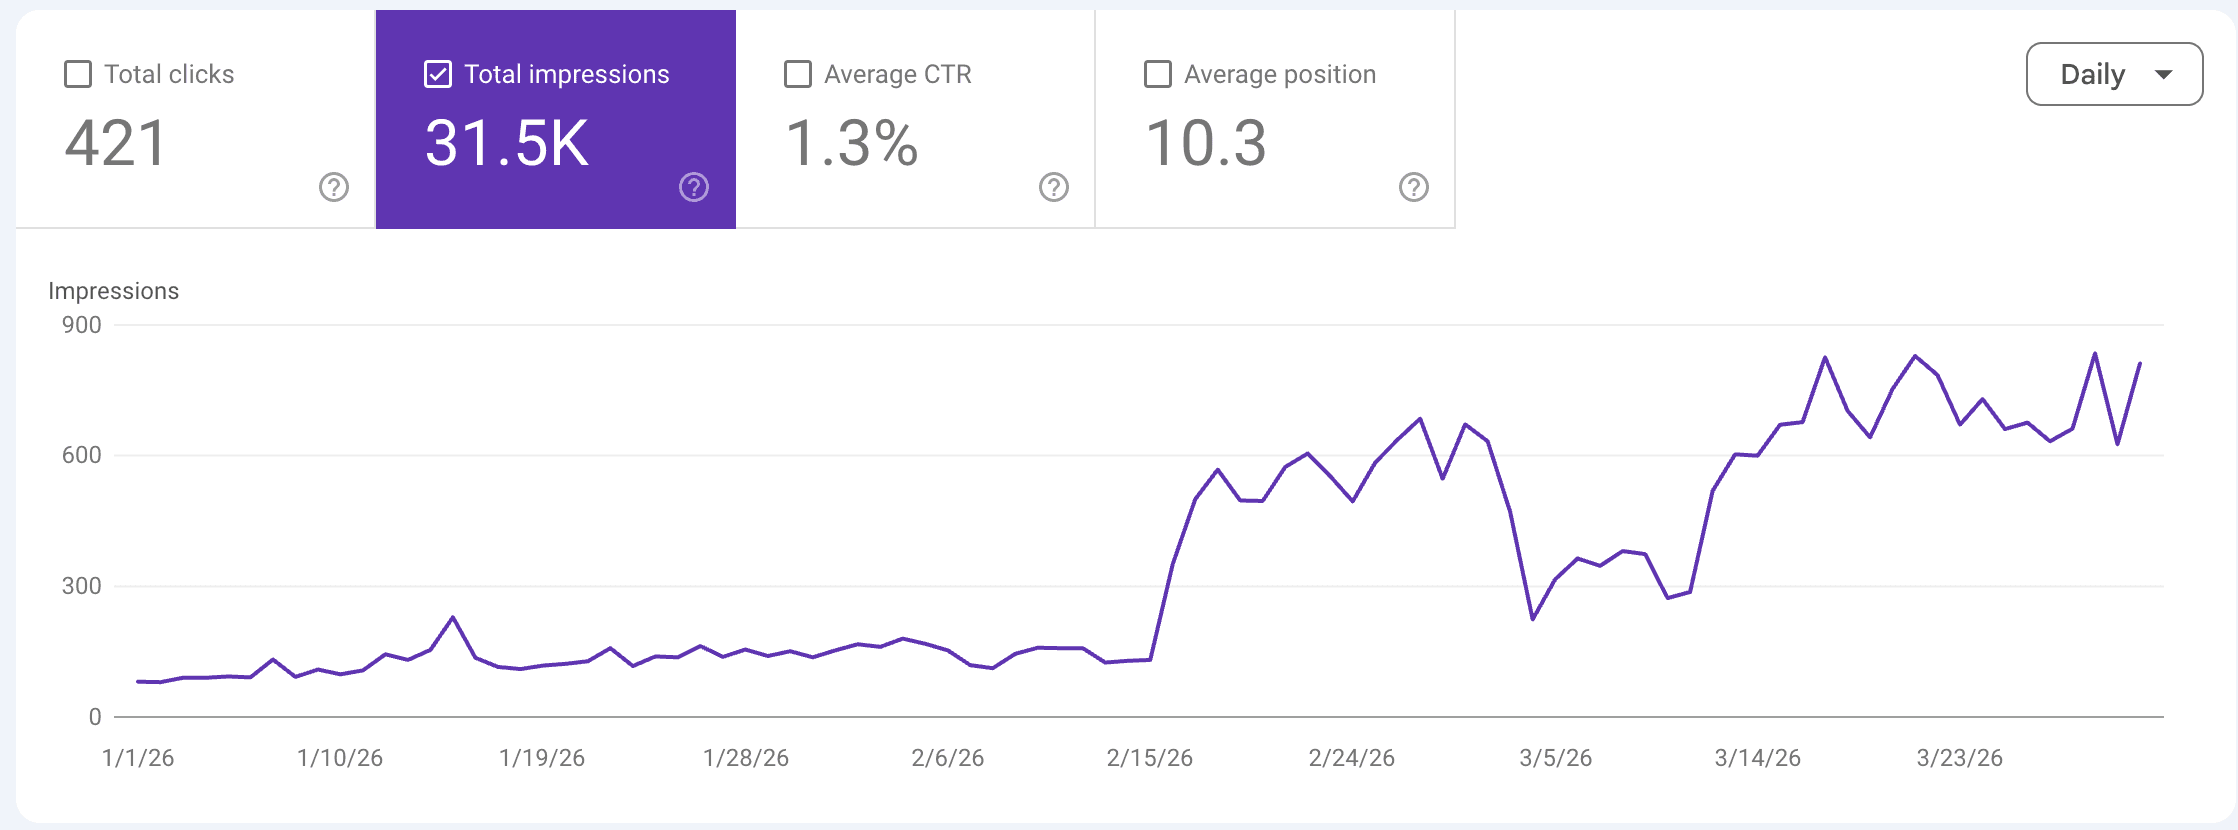
Search analytics example — Google Search Console performance for a luxury real estate team

Paid analytics

  • Google Ads performance by intent segment, geo, and match type.
  • Cost per lead and cost per qualified conversation—aligned to CRM stages.
  • Return on ad spend with offline outcomes when uploads are configured.
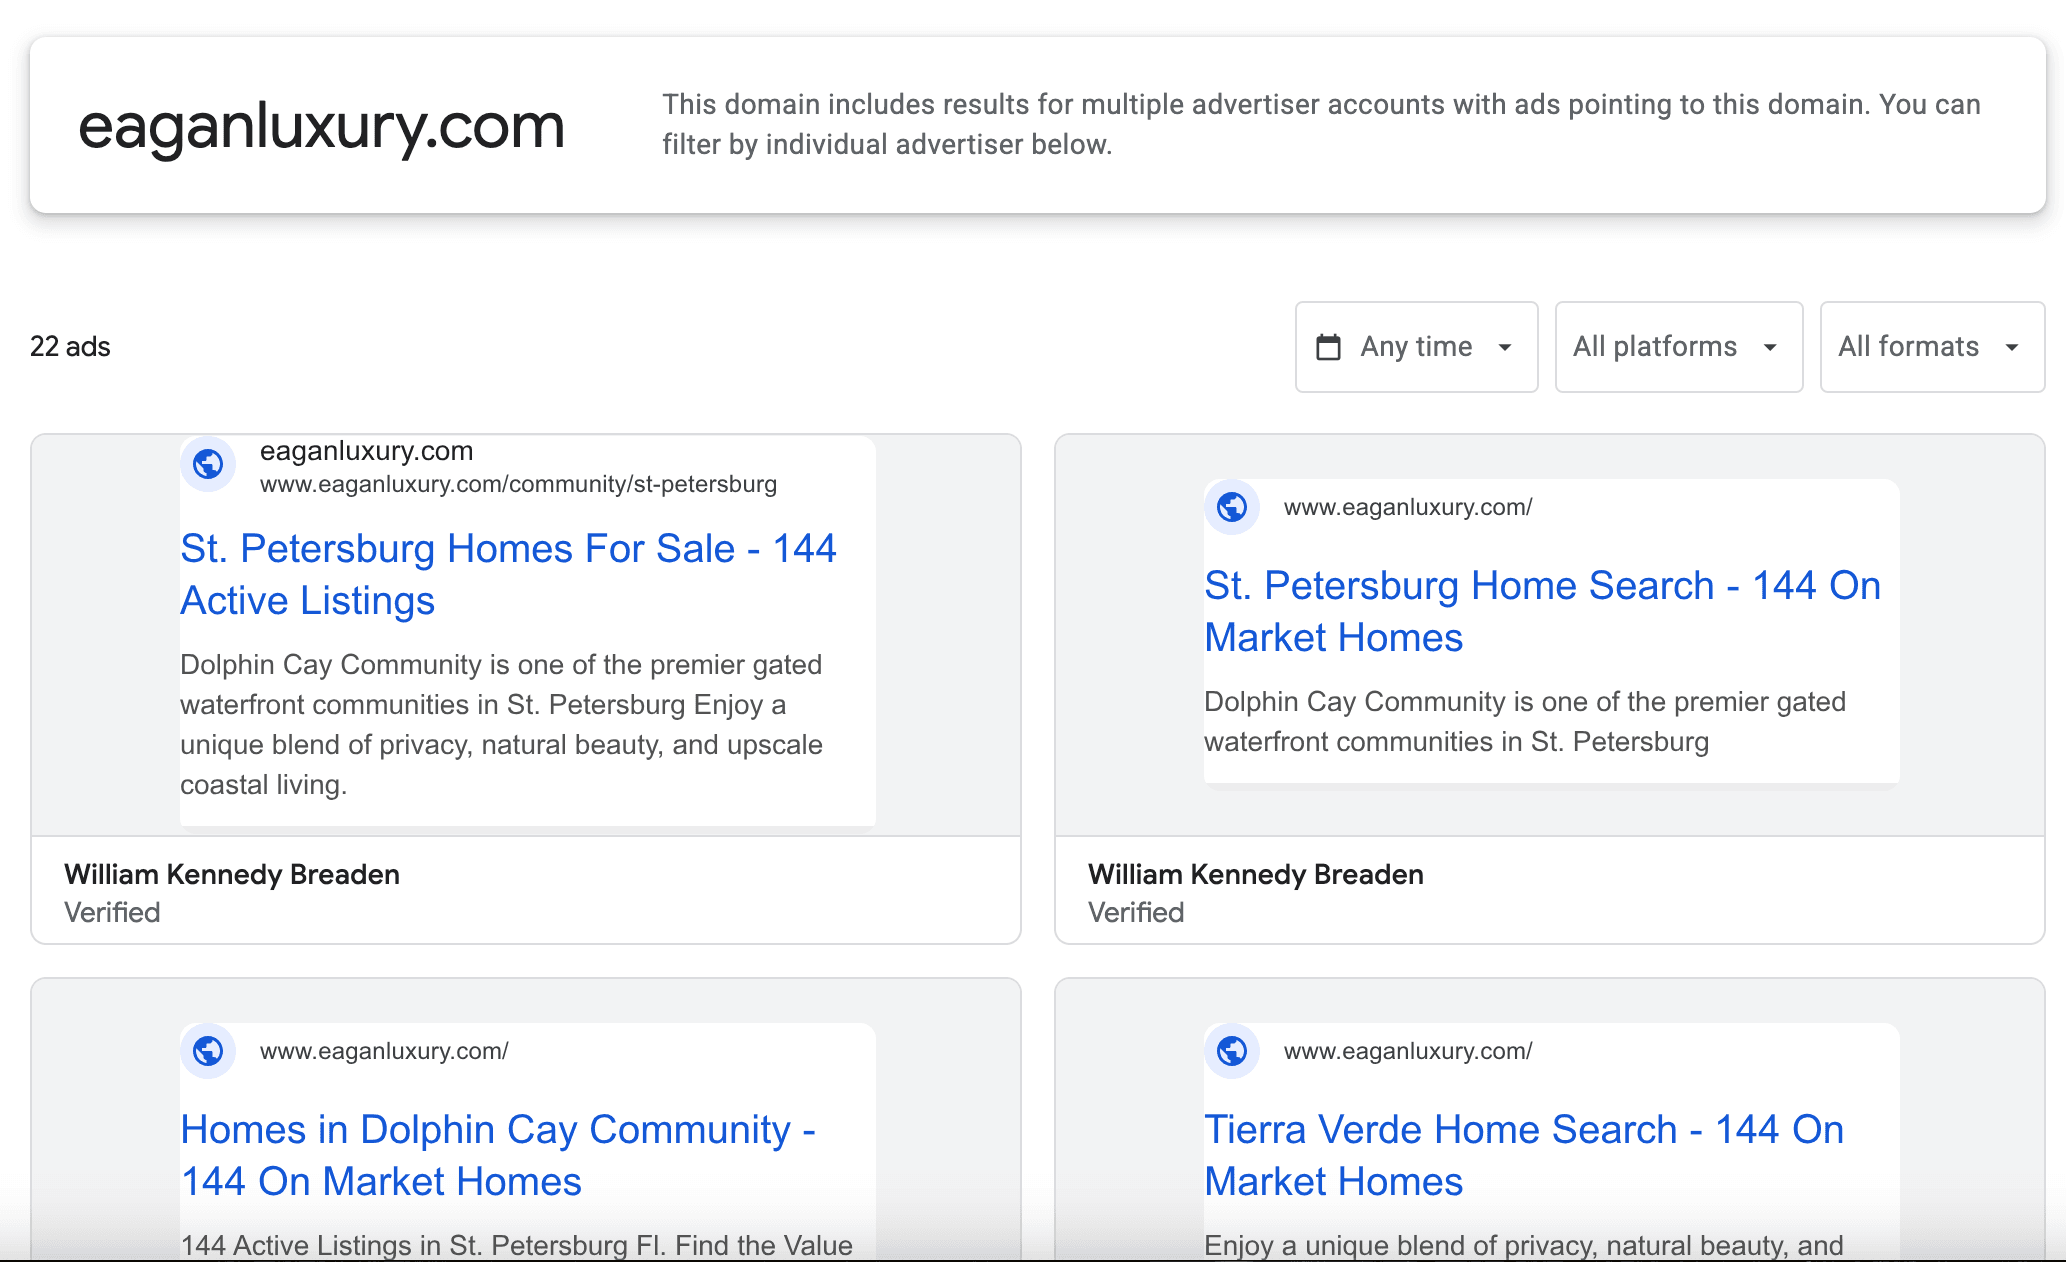
Paid analytics example — Google Ads campaign metrics

Lead analytics

  • Lead volume and quality by source, campaign, and landing path.
  • Conversion rates across forms, calls, and chat—surfacing friction fast.
  • Lead source attribution that survives multi-touch reality.
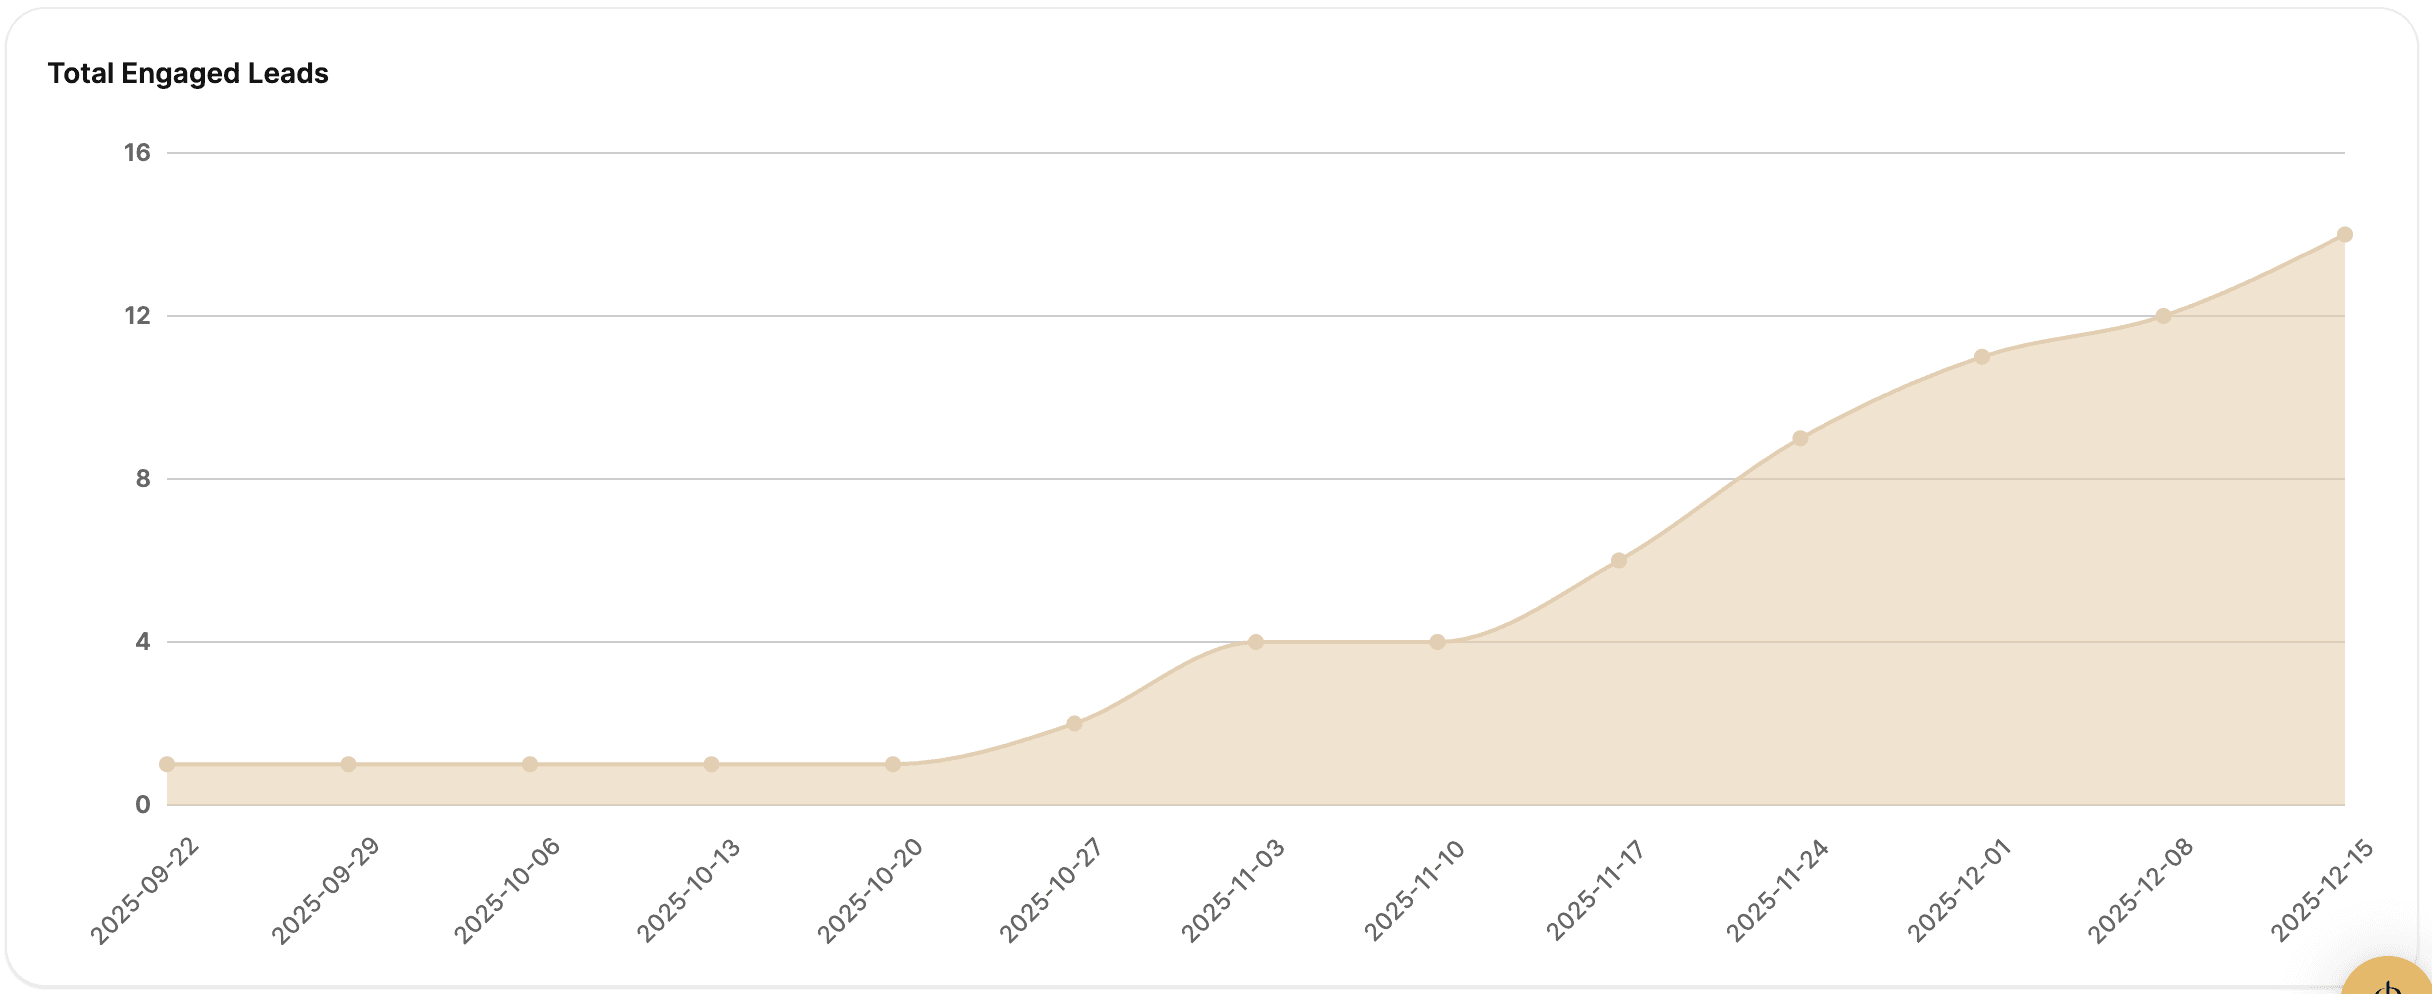
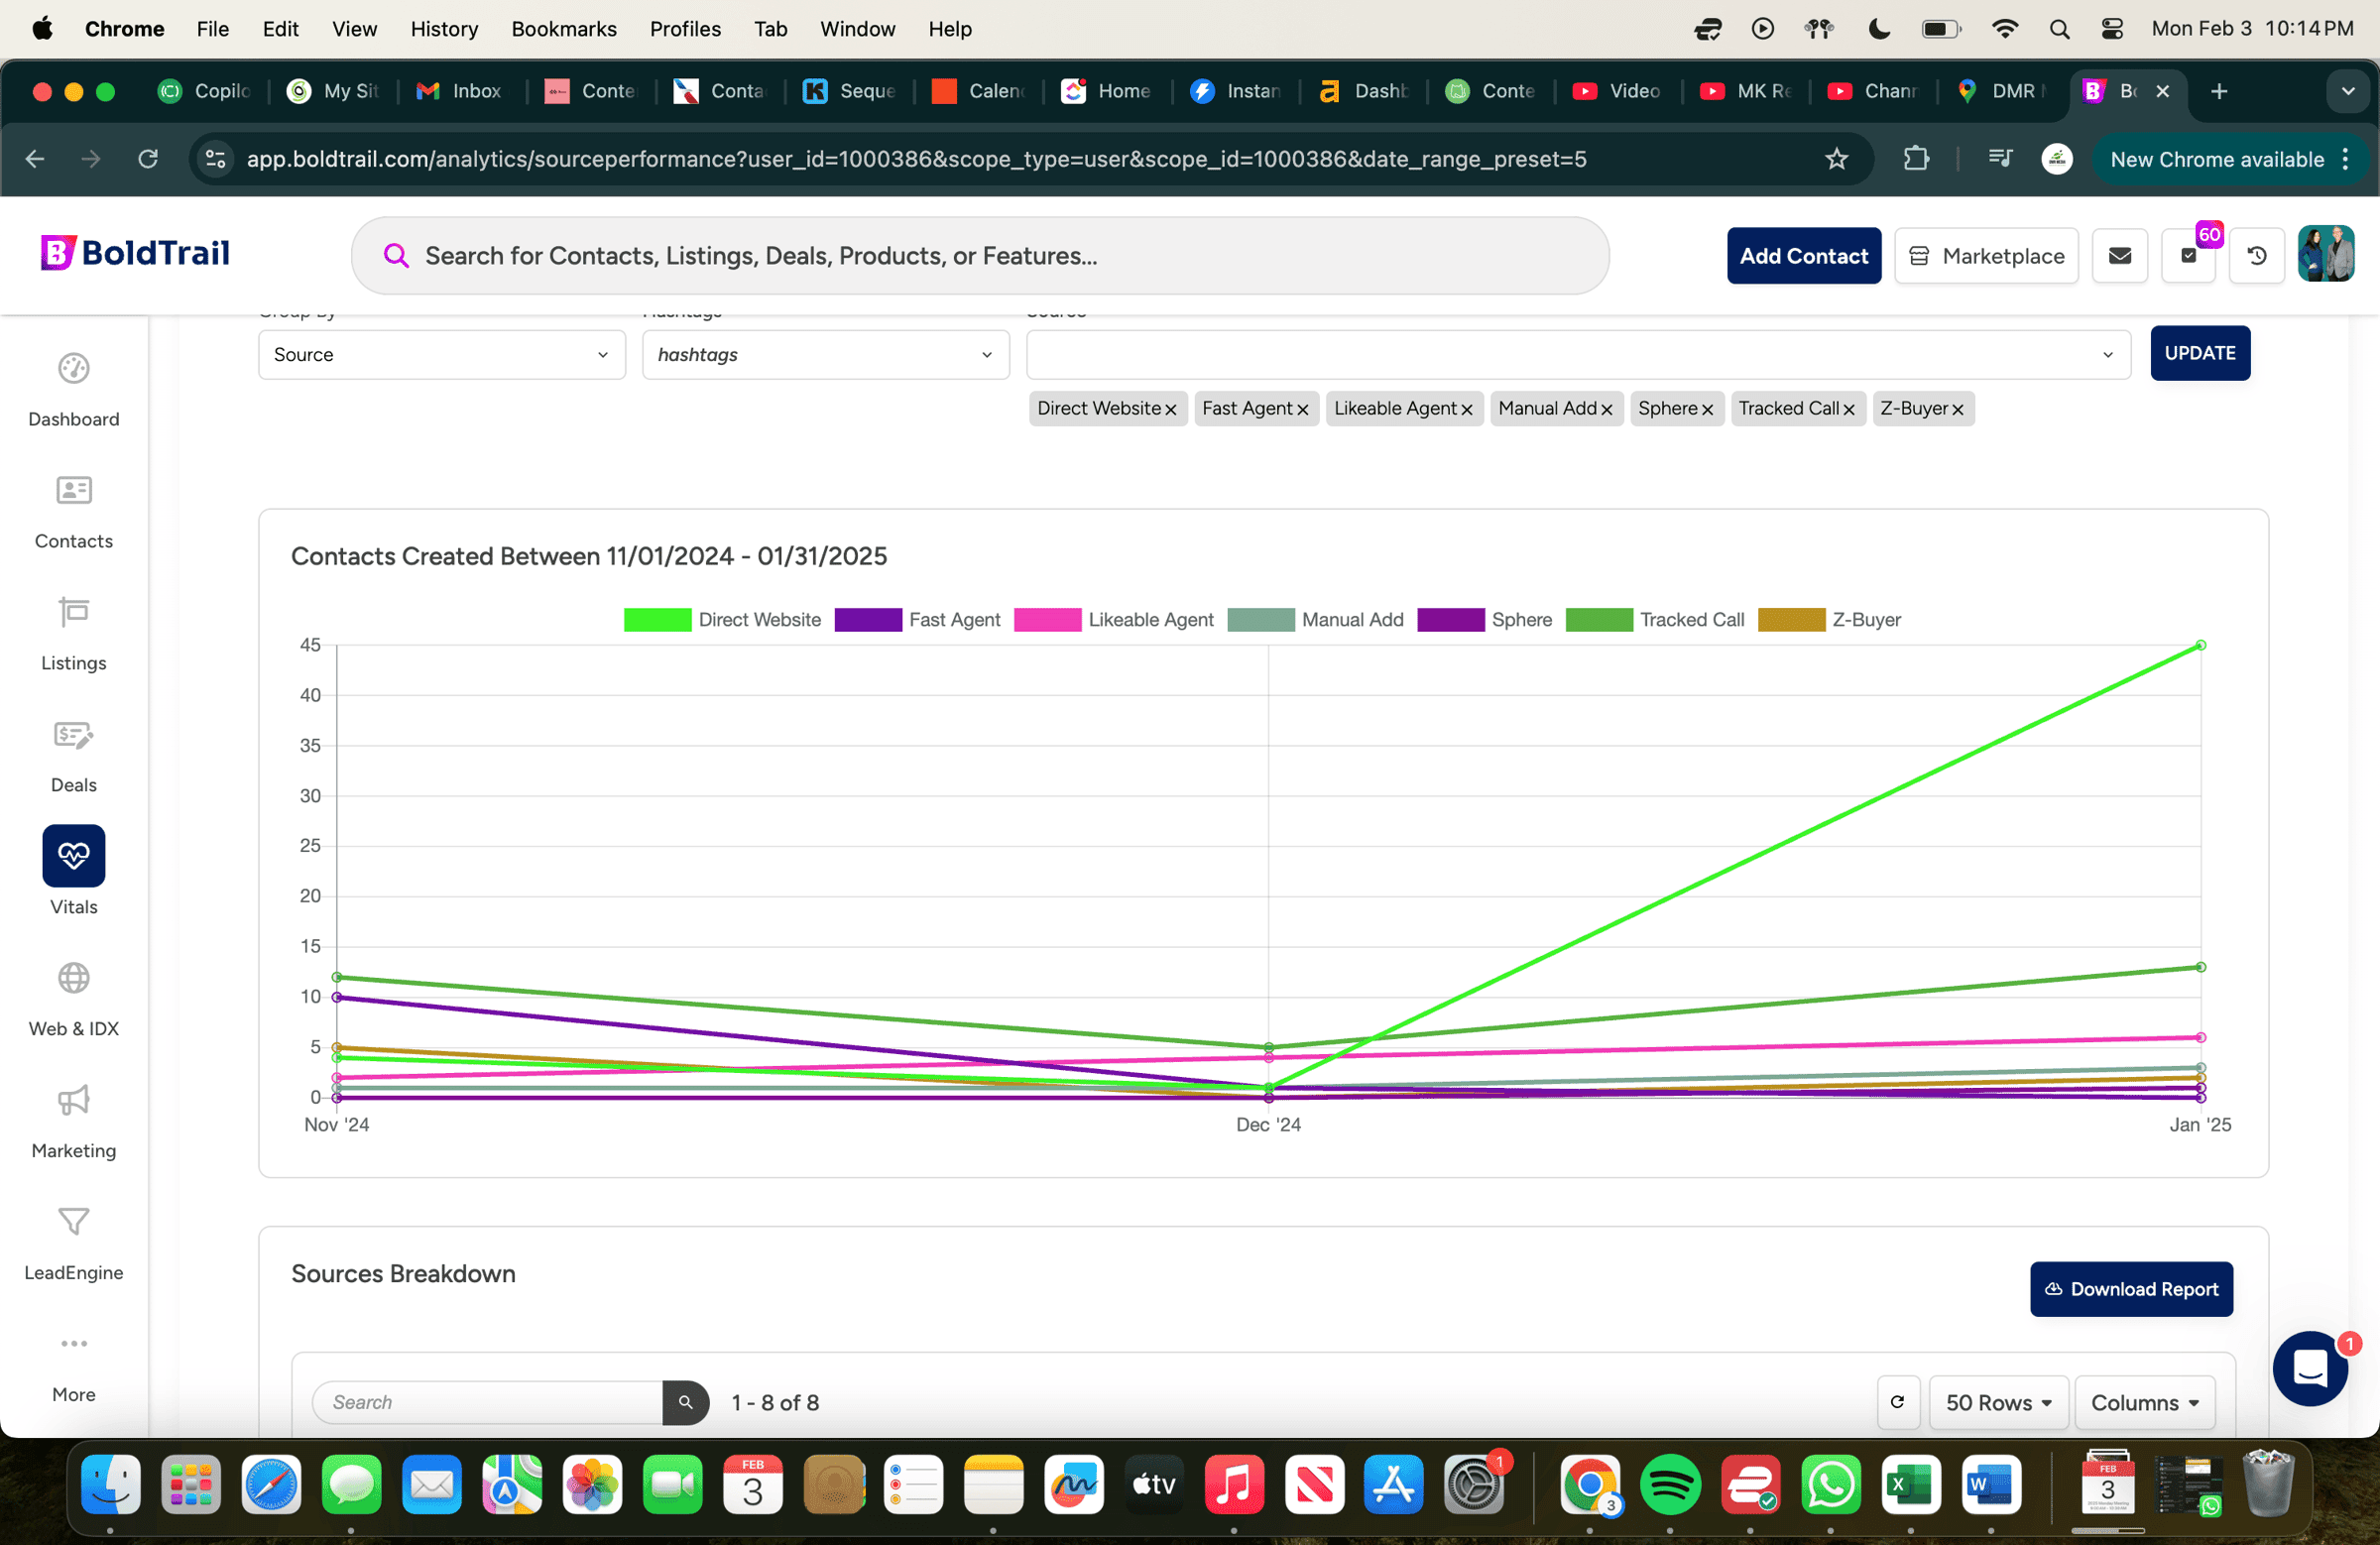
Lead analytics example — inbound leads dashboard

Site performance

  • Core Web Vitals and mobile experience—luxury media cannot tank LCP.
  • User behavior: scroll depth, engagement, and high-value page paths.
  • Conversion funnels from ad click to tour request—with drop-off callouts.
Site performance example — experience and search visibility signals

Our Reporting Process

Three tiers so operators get speed, strategists get narrative, and leadership gets decisions—not spreadsheets to decode alone.

Reporting structure

Tier 1

Real-time dashboards

24/7 access

Live Looker Studio views across search, paid, site, and CRM handoffs.

Tier 2

Weekly narratives

Strategic insights

What moved, what we are testing next, and budget implications—in plain language.

Tier 3

Monthly strategy reviews

Roadmap bets

Optimization recommendations tied to pipeline and inventory—not vanity charts.

What You Get

  • Real-time data updates across connected properties.
  • Custom metric tracking mapped to your CRM stages.
  • Automated alerts when CPL, volume, or site health crosses thresholds.
  • Export capabilities for board decks and broker reviews.
  • CRM integration and offline conversion feedback where supported.
Full analytics dashboard view — visibility, traffic, and campaign signals

Analytics across your DMR programs

Reporting ties directly to how we execute SEO optimization, Google Ads management, and real estate lead generation. Creative and IA live under website design; listing bursts under property marketing.

Analytics-Driven Success

Published engagements where dashboards changed what we built—not just how we summarized it.

Before → after: impressions ×21 in 7.5 weeks

Technical + reporting loop

Michael's analytics-led SEO reset

Abandoned IDX templates produced almost no measurable demand. Weekly dashboards exposed crawl and schema gaps; fixes shipped in priority order so leadership could see leading indicators move before rankings fully followed.

Read case study
Michael's analytics-led SEO reset — analytics-driven results

Before → after: 3× qualified leads in 90 days

Pipeline visibility in CRM

Jade's lead analytics discipline

Inconsistent lead flow was really an attribution and follow-up visibility problem. Unified reporting across paid, site, and CRM let the team double down on the segments that actually booked conversations—not vanity clicks.

Read case study
Jade's lead analytics discipline — analytics-driven results

Before → after: 2 → 38 organic clicks / day

Search Console → content priorities

Marquis + Farwell organic growth

Sonoma County visibility was under-indexed against true inventory strength. Search analytics surfaced neighborhood gaps; topical depth and GBP alignment compounded into daily organic clicks and qualified buyer inquiries.

Read case study
Marquis + Farwell organic growth — analytics-driven results

Frequently asked questions

What metrics do you track?
Search (rankings, impressions, clicks, CTR, query themes), paid (CPL, CPA, ROAS, search terms, quality score signals), leads (volume, source, stage velocity, form completion), and site health (Core Web Vitals, landing engagement, funnel drop-off). We align the scorecard to how your team defines a qualified conversation.
How often are dashboards updated?
Core connectors refresh on platform schedules—often near real-time for ads and site traffic, with Search Console on its natural cadence. Tier-1 dashboards stay live; tier-2 weekly narratives interpret movement; tier-3 monthly reviews prioritize roadmap bets.
Can I export the data?
Yes. Looker Studio and connected sources support PDF exports, scheduled email snapshots, and raw pulls from underlying accounts (Google Ads, GA4, Search Console, CRM) where you have access—so finance and leadership can work from the same numbers.
What if I use other tools?
We integrate the stack you already run—HubSpot, Follow Up Boss, Sierra Interactive, custom data warehouses—when APIs or exports exist. If a tool is opaque, we design proxy metrics so decisions are still defensible.
How do you track offline conversions?
We import CRM outcomes (appointments, tours, under contract) via offline conversion uploads or native integrations where supported, then tie them back to campaigns and landing paths so optimization chases pipeline—not just form fills.
Let's Work Together

Tell us what you’re building. We’ll make the market notice.

Share a few details about your goals and we’ll design a calm, measurable plan around them.

Specialization

Google Ads, SEO, and analytics frameworks for luxury real estate teams and developers.